Model explaination using SHAP
After training our XGBoost model and using it to do predictions, we used SHAP to try and get more explainations about the model.
This operation has been done in a notebook found at :
/notebooks/4.0-ANTD-SHAP-Analysis.ipynb
This first step is to load the saved XGBoost model and the test dataset.
Because it made it easier for SHAP to compute values, we are gonna take only a sample of our dataset by doing the following
sampled_data = data.sample(n=100)
After that we can begin to use SHAP.
We need to build the TreeExplainer and to compute shap values :
explainer = shap.TreeExplainer(xgb)

shap_values = explainer.shap_values(sampled_data)
With that done we can visualize explanations for a specific point of the dataset :
i = 0 #change this value to see another specific point of the dataset.
shap.force_plot(explainer.expected_value,shap_values[i],features=sampled_data.iloc[i], feature_names=features_names)
Here is the plot we get :

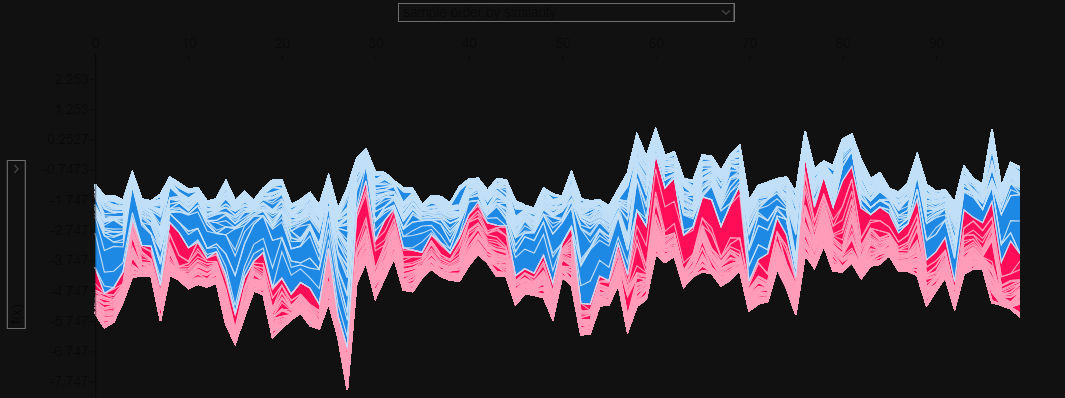
We can also visualize explanations for every point of the dataset :
shap.force_plot(explainer.expected_value,shap_values, features=sampled_data, feature_names=features_names)
Here is the plot we get :

The x and y values are adjustable with the two drop down menus and by hovering the graph with our mouse we can get more informations.
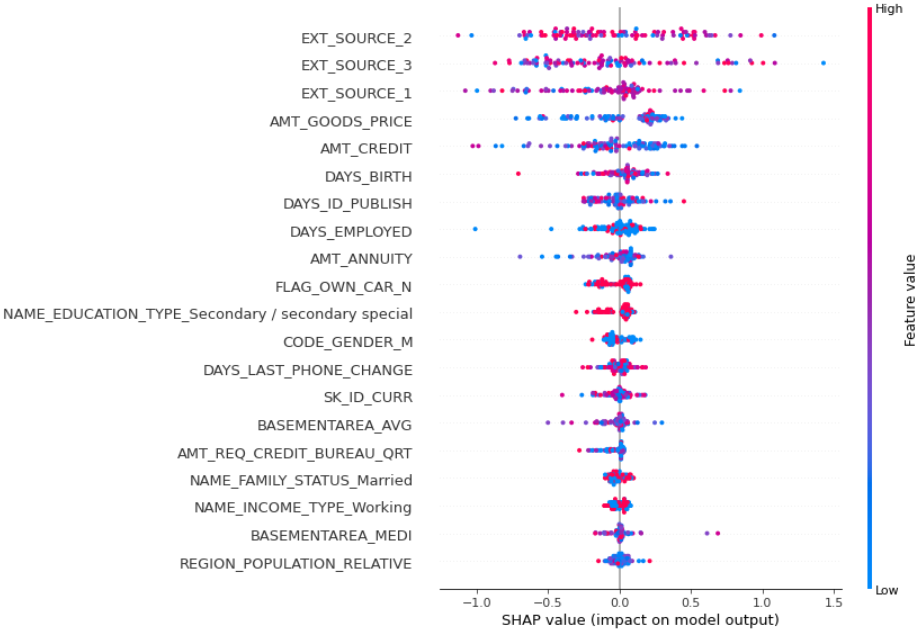
After that the final step is to plot a summary :
